Why fast? Lot of
academic researchers (Ritter 1991, 2009, 2013, Loughram et al 2008) found out
that US-listed IPOs can produce wealth to investors in
the First day of trading!
It wouldn’t be a
bad idea to buy an IPO share during the offer price period and sell it at the
end of the first day of trading, as that would give us an average return of
17.90% during the period 1980-2011. As reference to the period 1999-2000, the
average returns from selling shares at the first day it were 64.4% i.e.
buying 1$ IPO share we get 1.644$ and more recently during the year 2011
the average first day return was 13.3% which will give us, if we invest 1$, a
return of 1,133$. According to the above evidence, it is clear that average
first-day returns of the US-listed IPOs produce wealth for the investors.Think
about it more carefully, we can produce in one day wealth of 13.3% average?? so
if we invest 1000$ in a portfolio with IPOs before going public we can get
1133$ in one day!
Consider also this, in accordance with the Renaissancecapital, 2013 was the best year for the US IPO market since 2000. Against a favorable backdrop marked by a rising stock market, low interest rates, reduced volatility and increased risk tolerance among investors, a total of 222 companies went public and raised $55 billion. The window for US IPOs remained open throughout the year, unlike recent years characterized by bouts of stop-and-start activity. IPO performance beat benchmark indices, with an average return of 41%. Though these improvements have raised the question for some of whether 2013 portends an overbought, bubble market, valuations were disciplined. While health care, technology and consumer produced many of the year’s biggest hits, the increase in IPO activity was broad-based. With a building backlog of IPOs and economic indicators continuing to show signs of improvement, we anticipate another dynamic year for the US IPO market in 2014. Lot of forecasts present growth of approximately 20%, for IPOs into the 2014, which is about 66$ billion dollars proceeds.

Although, there are lot of factors we have to examine to achieve this (do not forget that we speaking about the total average US IPOs), but for rich people this observation may be useful!
After all, it will be interesting to present more data about the performance of the US-listed IPOs, such as Money left on the table for the period 1980-2013 and also Average first day-return, 3-year buy and hold abnormal return BHAR & 3-year BHAR Market-Adjusted during the years 1980-2011.
1. Money left in the table 1980-2013

2. Historical Data of Average
first-day, Average 3-year BHAR & Average 3-year BHAR Market-Adjusted,
returns of US-listed IPOs 1980-2011
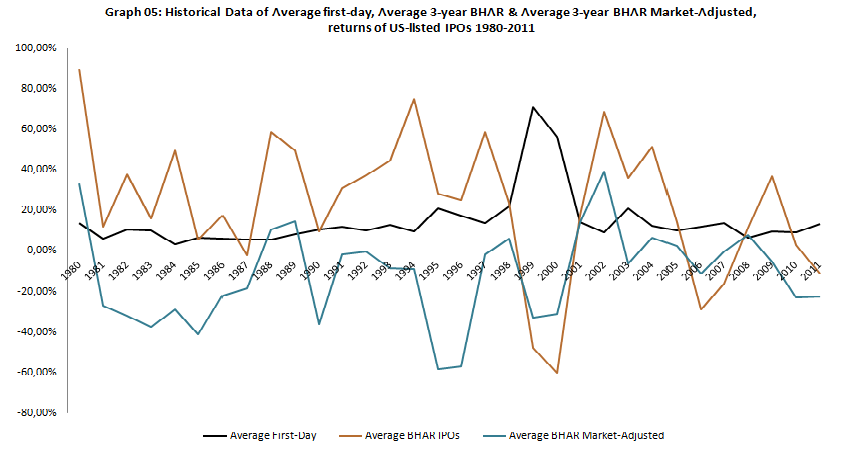
It is clear that the average US-listed IPOs in long-run are underperformed, but that is a phenomenon that we are going to analyze in another article. As for the short run, and especially the first-day in average US-listed IPOs produce wealth for the investors. The best performed industries are Pharmaceutical-Health, Energy, and Finance. The worst performance belongs to Shipping Industry, with average first day average return (excess return) of 4,44%. Thought, Shipping IPOs seems to perform better in long run than the other US-listed IPOs.
CG
No comments:
Post a Comment